High-Performance Computing Center Stuttgart
In 2018 the European Union funded the Open Forecast project, a consortium of 5 institutions that is using freely accessible data from government agencies and research organizations to develop tools to help non-scientists better visualize research results in an understandable way. As part of the consortium, researchers at the High-Performance Computing Center Stuttgart (HLRS) have been developing a tool for visualizing detailed air quality forecasts for the city of Stuttgart. The team’s work is intended as a proof of concept for developing user-friendly tools for providing the public with other kinds of useful, high-quality information.
HLRS provided HPC resources for a sub-project called the Particulate Matter Forecast Service, which is using the WRF weather and climate model—a well-known simulation code developed at the National Center for Atmospheric Research in the United States—in tandem with atmospheric chemistry calculations to model current and future concentrations of heavy particulate matter, nitrogen dioxide, and other pollutants. Climate scientists from the University of Hohenheim in Stuttgart ran these calculations on HLRS’s previous flagship supercomputer, a Cray XC40 system called Hazel Hen.
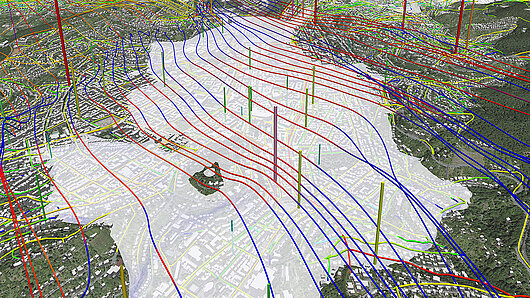
Visualization experts at HLRS then transformed the simulations into an interactive 3D projection that also included additional geodata and building information. “It is a really complicated data set with many properties, and it is a 3D simulation, so it is hardly possible to analyze it in 2D,” said HLRS researcher Leyla Kern, explaining the team’s decision to do these highly detailed 3D visualizations. “We then use 3D models to create an interactive tool. It is a lot easier to understand the processes and to improve accessibility—it is easier for non-scientists, such as members of the pubic or decision makers, to intuitively understand what data reveals.”
The initial modelling successes demonstrated the feasibility of running high-resolution simulations that combine complex atmospheric calculations with chemistry models. The researchers modelled high-resolution, 24-hour cycles of Stuttgart at 50-meter resolution, also taking into account complex aspects of Stuttgart’s geography. The city center is located in a valley, meaning that tools such as those being developed in Open Forecast help city planners determine where fresh air primarily flows into the city so they do not block it with dense urban development. Further, the visualization can identify pollution “hot spots,” providing government officials with information they can use to modify road construction plans in ways that better disperse emissions.
Ultimately, the project demonstrated how open data sources can be analyzed to create models using HPC resources, encouraging other research projects to focus more on using freely accessible data as inputs in their simulations. The work also lays the groundwork to further develop these simulations on more powerful machines for greater accuracy. Kern indicated that with next-generation machines such as Hawk, HLRS’s new Hewlett-Packard Enterprise Apollo 9000 system, researchers could improve the resolution of the model to include detailed information at the scale of individual buildings, and run simulations that represent changes in air pollution over longer periods of time.
To achieve these goals, however, Kern indicated that raw computing power, high-end visualization capabilities, and robust data storage resources are all essential, making fully integrated HPC centers the ideal locations to continue performing this kind of research. “For this project, we did not just need to have a supercomputer, but the whole center to enable a complete workflow,” she said. “Besides the expensive computation, you also need a lot of storage for the datasets, you have to connect pre- and post-processing, and then integrate the visualization. This is hardly possible without a full HPC centre.”
-Eric Gedenk
A member of the Gauss Centre for Supercomputing, HLRS is one of three German national centers for high-performance computing.