High-Performance Computing Center Stuttgart
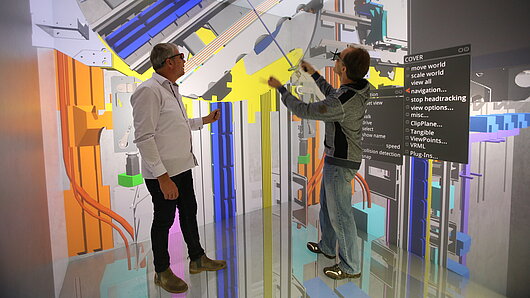
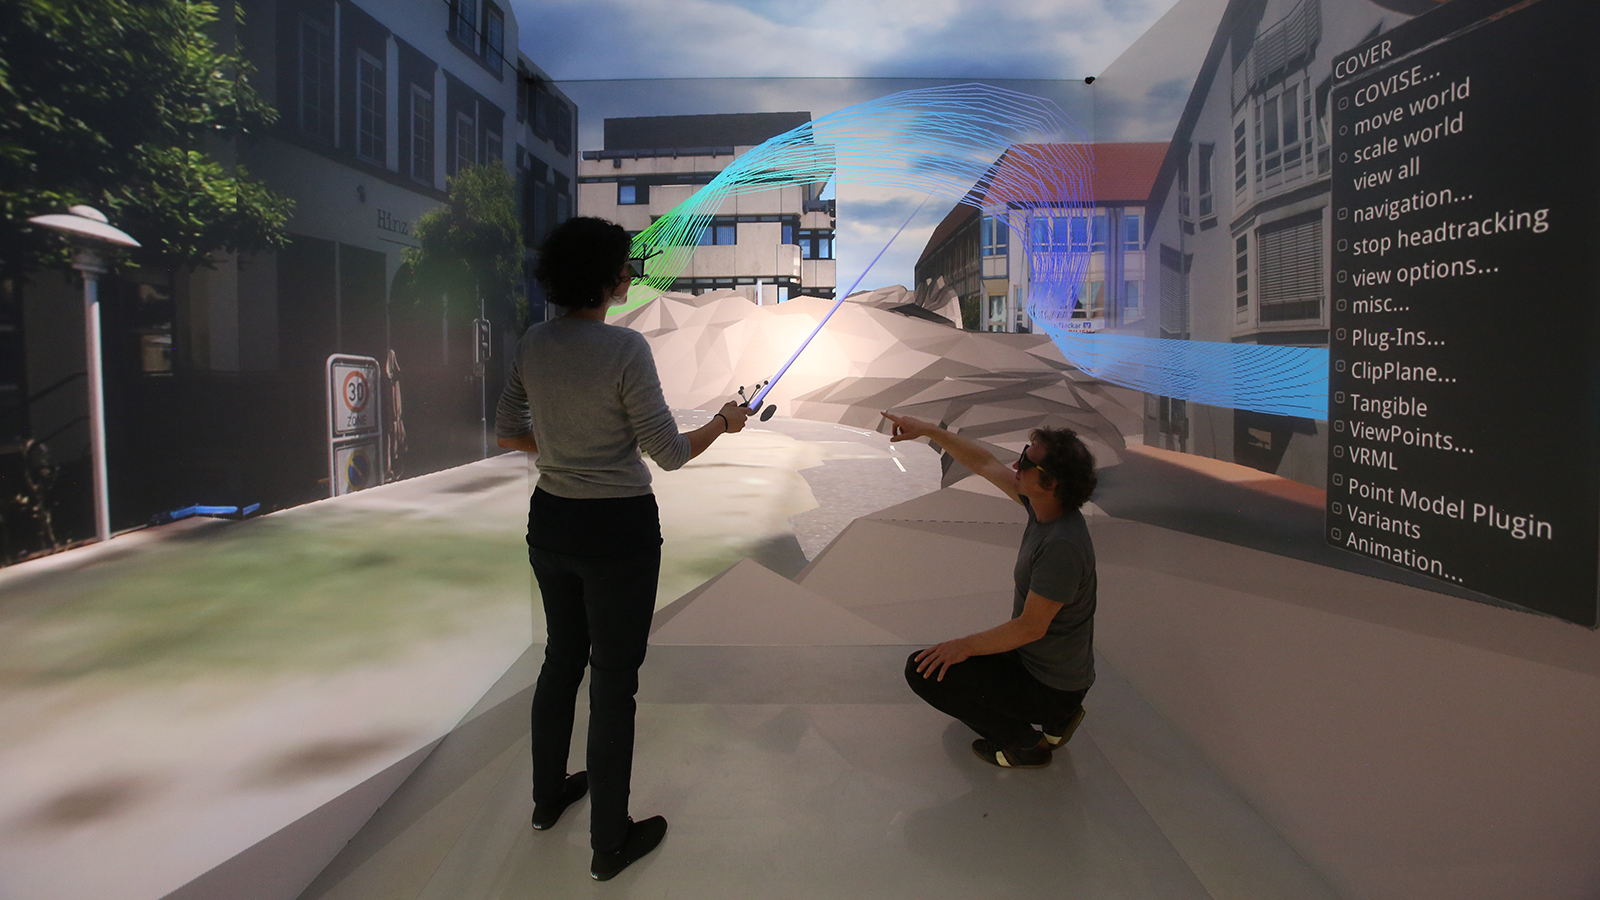
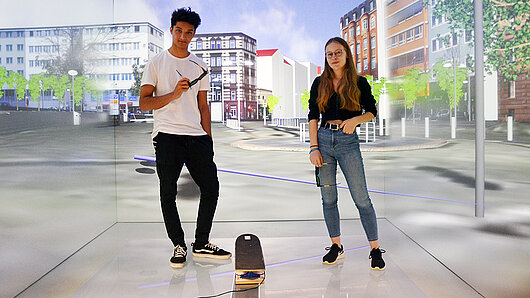
As simulation models become more complex and datasets grow ever larger, visualization of data has become an essential part of science and engineering. Immersive visualization can quickly and intuitively reveal patterns in simulation data and make it easier to understand how they represent phenomena that are impossible to see in the physical world.
The Visualization Department at HLRS offers powerful virtual reality and augmented reality tools for transforming abstract data sets into immersive digital environments that bring data to life. These interactive visualizations support scientists and engineers across many disciplines, as well as professionals in nonscientific fields including architecture, city planning, media, and the arts.